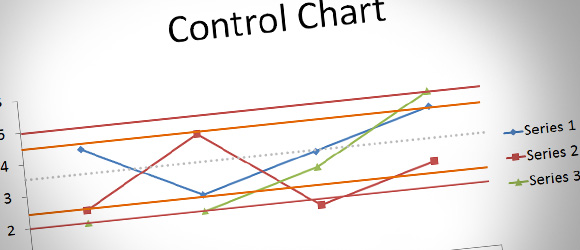
In our News entitled “Statistics and Process Validation: current Findings of the FDA“, we pointed out that the FDA has been observing more and more deficiencies in the area of statistics with regard to process validation. One of the “statistical methods” – also stated in FDA’s Process Validation Guidance – is the use of control charts in the context of a statistical process control (SPC). A SPC can be a valuable resource, particularly in stage 3 of the process validation lifecycle (continued/ongoing process verification).
During an event with the Product Quality Research Institute (PQRI), Dr Daniel Peng from CDER’s Office of Processes and Facilities (OPF) presented his views on the use of SPC under the heading “Using Control Charts to Evaluate Process Variability”. He began with the history of control charts and their fields of application. He furthermore considered the most important rules to create and manage control charts, including types of control charts, sampling and evaluation rules according to the Western Electric Rules.
He concluded his presentation with examples of control charts for evaluating intra and inter-batch variabilities and site performance monitoring.
The slides of the presentation “Using Control Charts to Evaluate Process Variability” are very easy to read and available for free.
Are you interested in SPC and control charts? On 18/19 February, the ECA organises the Education Course “Statistical Process Control – A key tool for process understanding in the process validation life cycle” in Heidelberg, Germany.
Filed under: Regulatory Tagged: Control Charts, Process Variability